
The speed reducers are an effective way to prevent car crashes
and I want to research on whether the amount of speed reducers
in each borough effects the amount of car crashes. I will use
various methods and equations to find average car crashes and
number of car crashes in relation to number of speed reducers
in every borough. This is a problem because speed reducers are
a major way to stop crashes from happening, and the data for
this project can help evaluate the possibility whether, having
more speed reducers effects crash rate.
I believe that there is a good relationship between the amount of speed reducers and car crashes in every borough.
This is because, speed reducers help prevent cars from speeding and potentially getting into accidents. However,
I
also want to analyze whether speed reducers can cause accidents or not, and whehter the current reducers are successful or not.
The Themes for this project revolve around:
Both data sets are related provide real information about NYC.
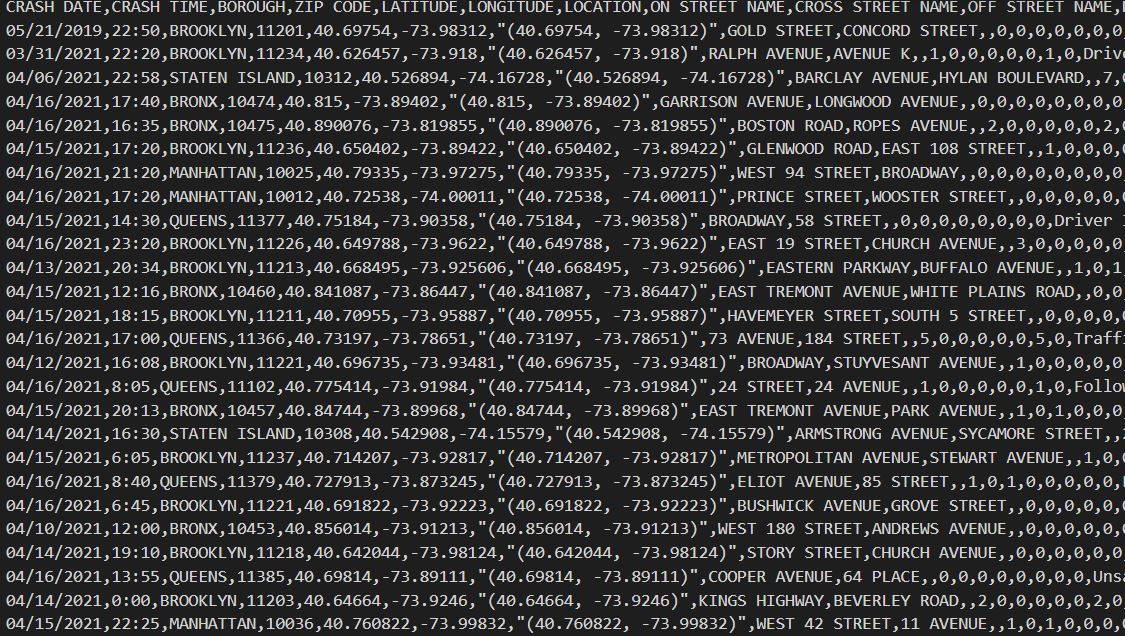
This Dataset contains all the accidents that have happened in NYC (every borough)
There are many attributes, but the ones that were the main focus include:
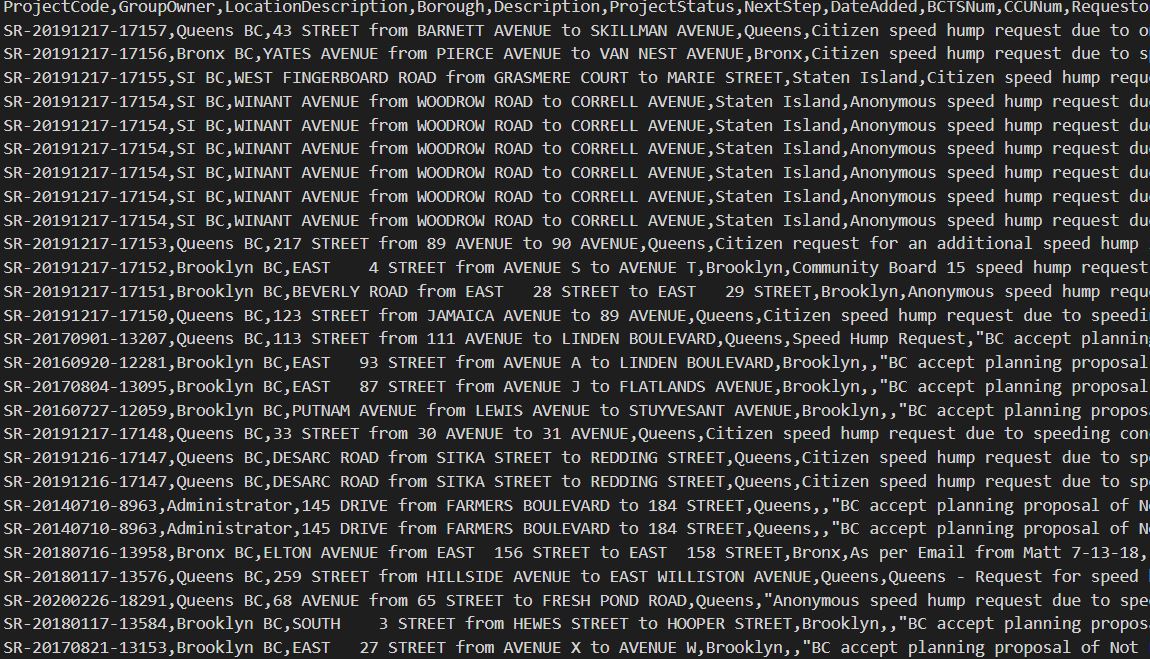
This Dataset contains the locations of all the speed reducers in NYC (every borough)
There are many attributes, but the ones that were the main focus include:
Python:
For This project, the python libraries pandas and pandasql were used in order to extract certain data from the datasets
and to perform queries in order to clean the data for better analysis.
For visualizations the library MatPlotlib was used. Due to this it was easier to display the analysis made.
The Goal of this project is to make different types of analysis, in order
to better understand the relation between car crashes and amount of speed reducers.
Some of these Analysis can be:
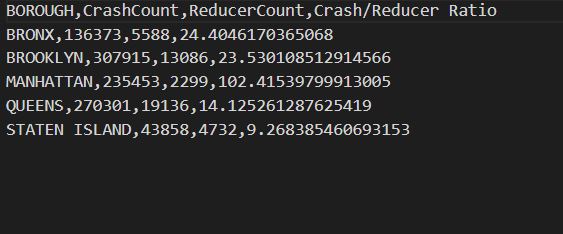
File 1: Counts and Percentage based on Borough (created using Join of both Data sets)
Distinct Borough Name, count of car crashes per borough, count of speed reducers per borough, a percentage of totalcrash/totalreducer.
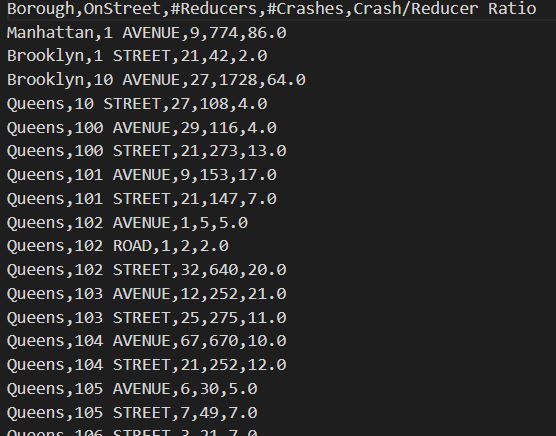
File 2: Counts and Percentage Based on Street (created using Join of both Data sets)
Distinct Borough Name, Street Name, count of car crashes per street, count of speed reducers per street, a percentage of totalcrash/totalreducer.
File 2 extended: Displays ALL the streets that need more reducers because of above average crash rate, done by first calcuating the mean
crash total and then comparing with each street
File 2 extended: Displays ALL the streets that dont need more reducers because of below average crash rate, done by first calcuating the mean
crash total and then comparing with each street
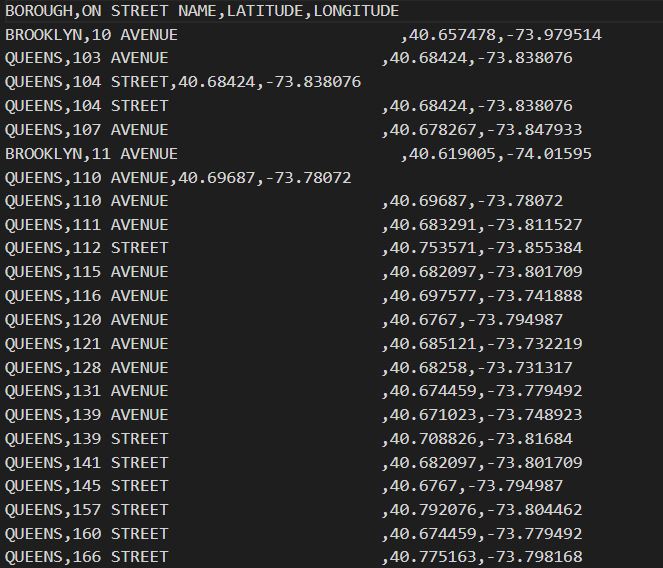
File 3: This File displays the streetName, Lat and Lon of all the reducers that have caused accidents, analyzed through checking all the
latitute and longitute of reducers and car crashes that match
This File displays:
1) The Borough Names for each street
2) All the Street Names from each borough
3) The number of crashes per street
4) The number of reducers per street
5) The ratio of crashes/reducers
For the analysis of this data, both datsets were joined using the borough so that a correct count
of crashes and reducers can be calculated by borough.
There was not much pattern seen, in whether number of crashes per borough is affected by the number of reducers in that borough
However, it was noticed that, Manhattan has the highest crash/reducer ratio out of all the boroughs
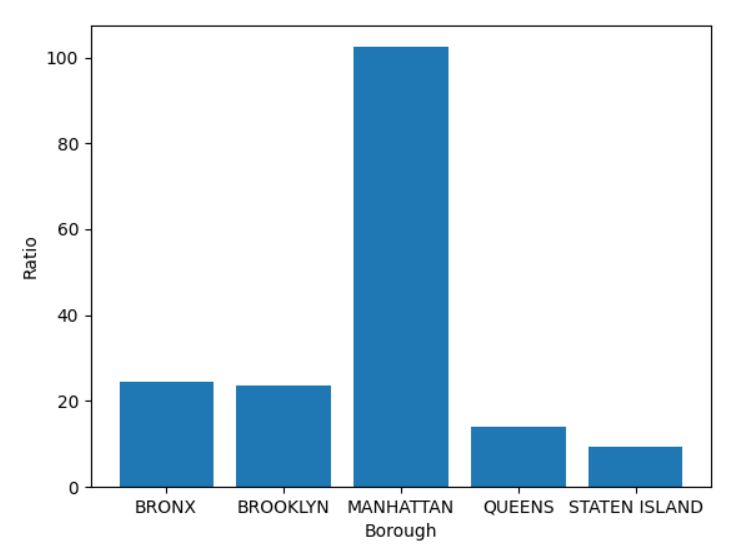
This visualization shows the crash/reducer ratio as a bar graph.
This can allow us to better picture the relationship between the amount of crashes per borough and the
amount
of reducers per borough.
As we can see, Manhattan displays the highest ratio, therefore it can be concluded that manhattan needs more reducers.
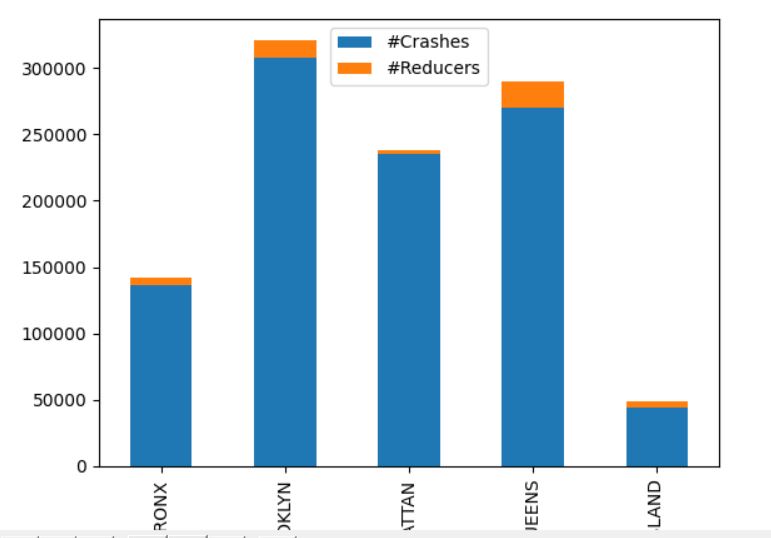
This visualization further allows us to see the amount of crashes in comparison to the amount of speed reducers
per borough. Overall, Brooklyn has the highest amount of crashes and Staten Island has the least.
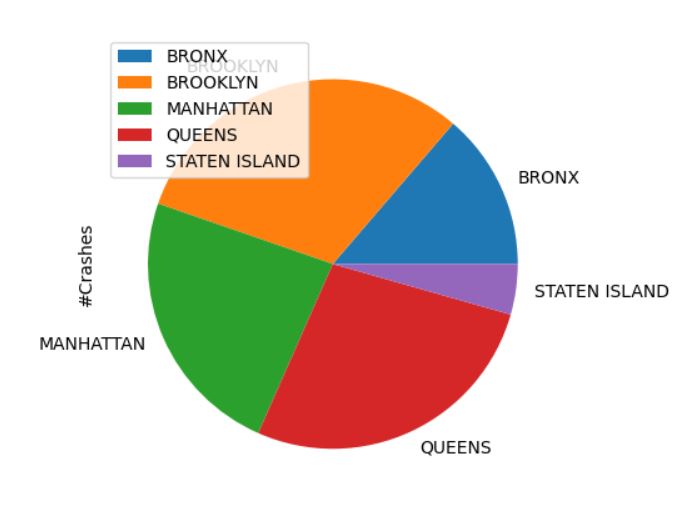
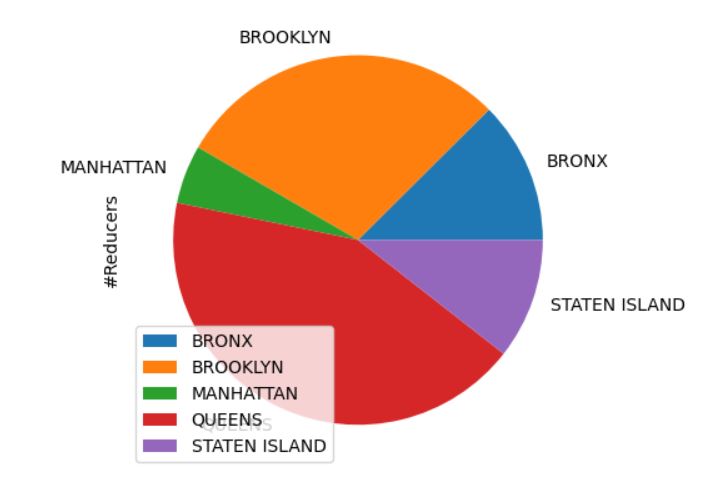
As it can be seen in the pie plots above, Queens appears to have more speed reducers in comparison to the crashes
in all 5 boroughs, and Manhattan appears to have significantly lower amount of speed reducers in comparison to the crashes.
Other, then that, Brooklyn, Bronx and Staten Island are around the same.
So due to the crashes and reducer ratio in Brooklyn and Bronx being similar, the ratio can be brought down if there was an increase in speed reducers.
Furthermore, Manhattan significantly needs more speed reducers in order to bring down car crash rate. Staten Island seems balanced due to a low ratio
of crashes/reducer
This File displays:
1) All the Distinct Borough Names
2) The number of crashes per borough
3) The number of reducers per borough
4) The ratio of crashes/reducers
This data was analyzed through the joining of both datasets with street names as the main key. This
allowed fo the display of crashes
and reducer ratio per street, to go further into detail apart from just analyzing per borough.
There was a partial pattern noticed in the borough of Manhattan as observed in the previous File, the ratio was the largest.
The streets in Manhattan with the least reducers have a large amount of crashes.
As will be seen in the next outcomes, the mean rash/recuder ratio, will help analyze the street crashes further.
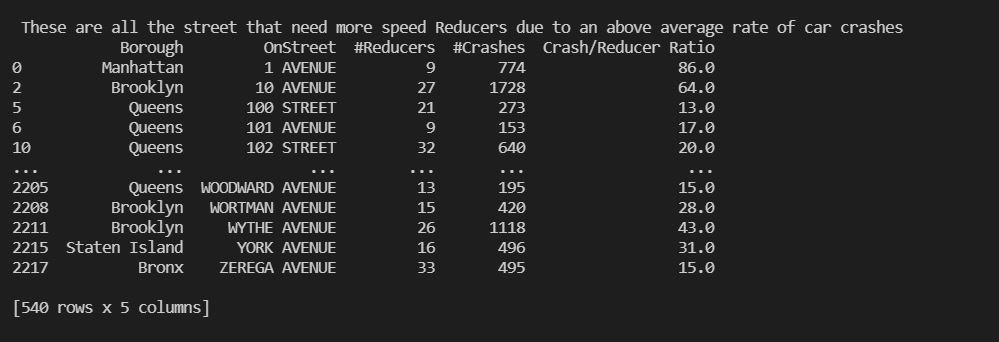
This displays all the streets that need more reducers due to their ratio being above the average ratio.
This is evaluated by the comparison of the average ratio with each street in the dataframe and selecting
all the streets that have an above average ratio.
This was analyzed by using the previous data of street analysis and comparing the mean ratio with the
street specific ratio.
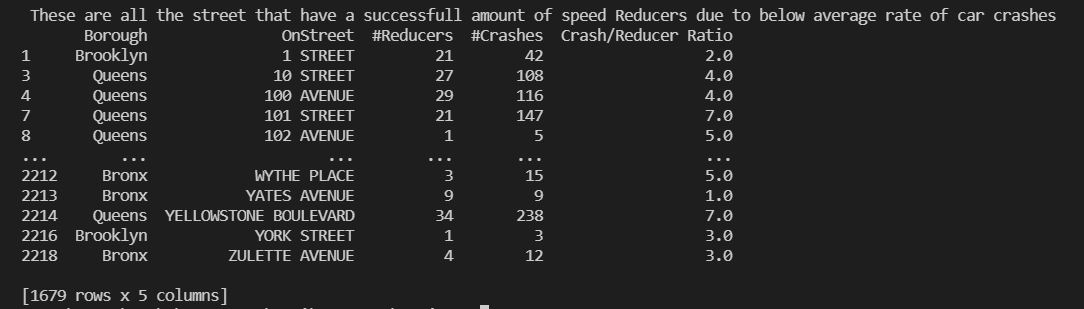
This displays all the streets that dont need more reducers due to their ratio being below the average ratio.
This is evaluated by the comparison of the average ratio with each street in the dataframe and selecting
all the streets that have a below average ratio.
This was analyzed by using the previous data of street analysis and comparing the mean ratio with the
street specific ratio.
This evaluation allows us to see the latitude and longitude of all the reducers
and crashes that are viewed thorugh a join statement. This helps us to see which crashes occurerd in the places that
have reducers, allowing us to understand that, the crash could have been caused by the reducer. This can further help us to understand whether
the reducer is necessary in that certain position
This was analyzed through the joining of both tables with the street names and
the longitude/latitude as the keys.
This analysis is critical in that, it can help to better understand whether there are reducers needed in certain cituation, such as a busy street
in a specific location or a non-busy street (which attracts speeders).
Overall, it can be concluded that there was a relationship noticed between speed reducers and car crashes.
This is because the boroughs such as, Manhattan, Bronx and Brooklyn have alot more reducers
in comparison to other boroughs, However they also have significantly large crashes as well. This same correlation was observed when looking into street by street view.
The streets of the boroughs have similar correlation as observed with the borough data.
This can show that having more reducers can significantly affect the crash/reducer ratio. Furthermore, it was analyzed that there appear to be many reducers that have caused accidents and should be looked into.
However, there are many reducers that are very successful in preventing accidents from happening.
Name: Syed Hussain
GitHub (Source Code): Syedhussain894
Emplid ID: 23514894
LinkedIn: Click Here
Dataset Sources: Motor Vehicle Crashes and Speed Reducers